Population Dynamics I
 At the end of July, the United Nations Population Division released the key findings of the 2015 revision of its periodic World Population Prospects series. The UN’s median variant projections now are for a world population of 8.5 billion in 2030, 9.7 billion in 2050 and 11.2 billion in 2100. These figures are a slight increase over those in the 2012 Revision due to more complete data from the 2010 round of national censuses, re-estimation of historical fertility rates and modest changes in other assumptions resulting in a 1.8% increase in the median projection for 2050 and a 3.3% increase for 2100. At the end of July, the United Nations Population Division released the key findings of the 2015 revision of its periodic World Population Prospects series. The UN’s median variant projections now are for a world population of 8.5 billion in 2030, 9.7 billion in 2050 and 11.2 billion in 2100. These figures are a slight increase over those in the 2012 Revision due to more complete data from the 2010 round of national censuses, re-estimation of historical fertility rates and modest changes in other assumptions resulting in a 1.8% increase in the median projection for 2050 and a 3.3% increase for 2100.
Half of the increase in world population will occur in nine countries: India, Nigeria, Pakistan, the Democratic Republic of Congo, Ethiopia, Tanzania, the US, Indonesia and Uganda in declining order. Though fertility in India is expected to fall below the replacement level by 2040 or before, population momentum based on a large population of child-bearing ages will continue to drive the total upward to 2050 before beginning a gradual decline to 2100. Indonesia will experience a similar trajectory. In the United States, fertility will remain stable at below replacement rates, but immigration is expected to continually increase the population to over 450 million by 2100.
In 43 countries the population is actually projected to be smaller in 2050 than currently, with the five largest of this group being China, the Russian Federation, Japan, Germany and Thailand in declining order. The Japanese population is projected to decline by 15% by 2050 and the Russian by over 10%. As with the increase in the US population due to immigration, the decreases for those countries projected to have smaller populations in the future are predicated on historical patterns of migrant flows which conceivably could change substantially. Countries with declining populations may become both more accepting of immigrants and more attractive to those seeking to emigrate.
The key findings of the 2015 Revision are substantially the same as in the previous edition of the Prospects. Total fertility world wide is expected to continue to decline to 2.25 in the 2045-50 period and 1.99 iPopulation Dynamics In 2095-2100. As also previously highlighted, a very significant consequence of this decrease will be the aging of the population everywhere. For the world the median age, the point which divides the population into halves, increases from 29.6 currently to 36.1 in 2050 and 44.7 in 2100. As many as 35 countries will have a median age over 50 in 2100. Globally, those 60 and older are projected to double in number by 2050 and triple by 2100, while the number of those 80 and older is expected to increase by a factor of seven by 2100.
The UN Population Division is the primary source for world population data. A number of other organizations, however, both private and governmental, make projections at various intervals and for all or portions of the world. Most of these projections follow a methodology similar to that of the UN and the results fall within a relatively narrow range. But a group at the respected Wittgenstein Centre for Demography and Global Human Capital in Austria argues that education is a key driver of fertility and needs to be incorporated into the projection model.
In a recent article entitled “The human core of the shared socioeconomic pathways,” Samir KC and Wolfgang Lutz lay out five scenarios of future development and population change. These range from one that assumes the world proceeds on a more sustainable path to another that foresees a more fragmented world where security rather than international development is emphasized. Only in this latter, “worst case” assumption does their projection exceed that of the UN medium variant, reaching 12.6 billion in 2100. The UN high or worst case variant, which assumes a fertility rate one half child greater than the medium variant, projects a population of 16.6 billion in 2100.
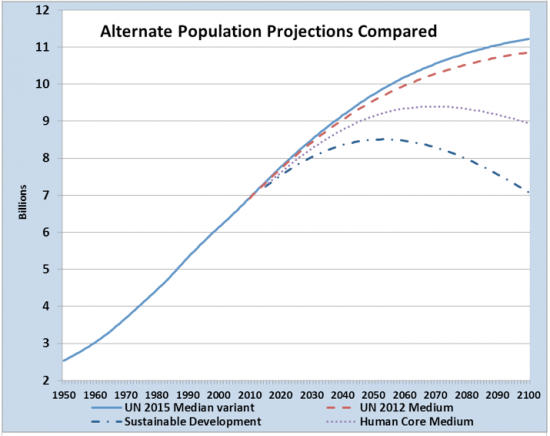
Historical population figures and UN projections are from the 2012 and 2015 Key Findings. The Sustainable Development and Human Core Median lines are constructed from data in the Wittgenstein Centre Data Explorer found at http://www.oeaw.ac.at/vid/dataexplorer/. Figures in the current KC and Lutz article differ slightly from this earlier series, but the article provides only values for 2010, 2050 and 2100 which are insufficient for graphing. Final, and more complete figures, for the shared pathways project will be published by the end of the year.
On the other hand, like the UN low variant, which assumes a fertility rate one half child below the medium projection, three of the scenarios derived by KC and Lutz project a decline in population in the latter part of the century. In the shared pathways models, population decline begins somewhat later and does not appear to be as great as the UN low variant with its broad assumption about fertility rate reductions. But, by incorporating increased educational levels as one of the variables, these models introduce the dynamic that produces lower fertility rates and can actually create a tipping point in population growth.
Education level is a marker for the improved living conditions which as a whole produce the conditions in which individuals choose to limit the size of their families. It is also being seen by an increasing number of analysts as a necessary and even fundamental component of economic development. For those concerned about population growth and the wellbeing of the global poor, this indicates a strategy that can address both goals. The KC and Lutz sustainable development pathway, shown in the above chart, assumes that as countries make investments in education and health, their transitions to lower fertility rates will accelerate. Rotarians can be most effective by encouraging such public investments and by contributing directly to projects that improve education, health delivery and other conditions of wellbeing.
KC and Lutz do not differ from the UN key findings on global aging of the population and continued heavy migration. These are very significant population dynamics and will be taken up separately in subsequent posts.
George Prather, PhD
**Historical population figures and UN projections are from the 2012 and 2015 Key Findings. The Sustainable Development and Human Core Median lines are constructed from data in the Wittgenstein Centre Data Explorer found at http://www.oeaw.ac.at/vid/dataexplorer/. Figures in the current KC and Lutz article differ slightly from this earlier series, but the article provides only values for 2010, 2050 and 2100 which are insufficient for graphing. Final, and more complete figures, for the shared pathways project will be published by the end of the year. |

 How to cut child mortality in half… again
 Invitation to Big Pink in Spanish
 Sign up for Momentum Newsletter
 Webinars by Knowledge Success
 TENA Technical Expert & Networking Alliance
 Perinatal Mental Health (PMH)
 Training Resource Package